Visualization · Global development
Global health and wealth, seen over time
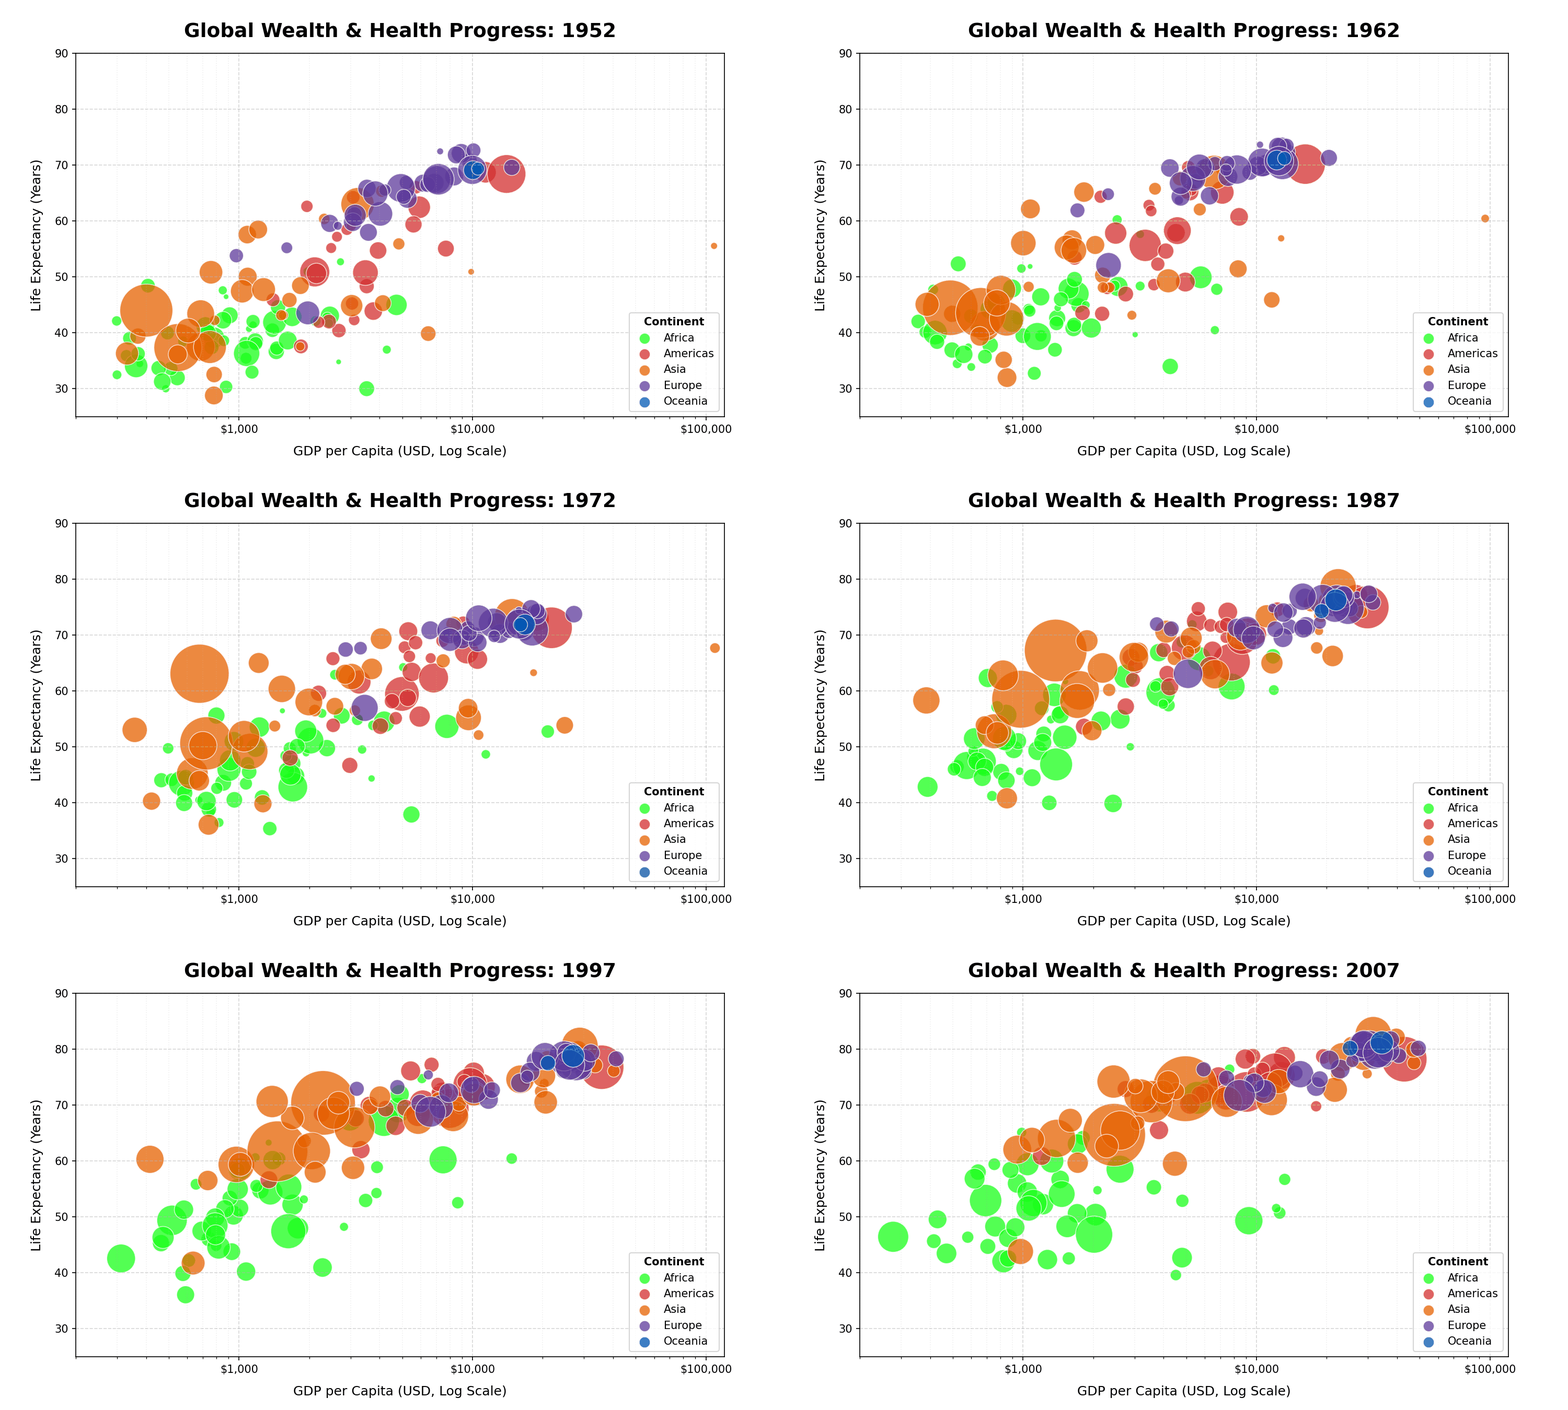
The movement is the point: as countries travel through decades, the chart lets changes in longevity and income be considered together rather than as disconnected rankings.
What becomes easier to see
The moving groups trend upward and rightward, indicating longer life expectancy alongside higher GDP per capita for many countries. Population-scaled bubbles keep large countries visible while the animation reveals that progress is uneven rather than uniform.
The view is especially useful for following the change in relationships over time. A still ranking can compare one year; motion makes shifts in distribution and pace easier to notice.
- Data
- Gapminder dataset
- Method
- Pandas and Matplotlib animation
- Encoding
- Income, life expectancy, population, continent
How it was made
The visualization uses Pandas for data loading and Matplotlib for an animated scatter plot. GDP per capita uses a logarithmic axis to keep lower and higher income values legible in the same view; bubble area is scaled from population.
Limitations
GDP per capita and life expectancy are broad indicators. Their movement together does not establish causation, and country-level values can conceal inequality, regional variation, and changes within a population.