Selected work

Questions, evidence, and the decisions between them.

A selection of published analysis. Each case study makes the question, contribution, evidence, and limits of the data visible.

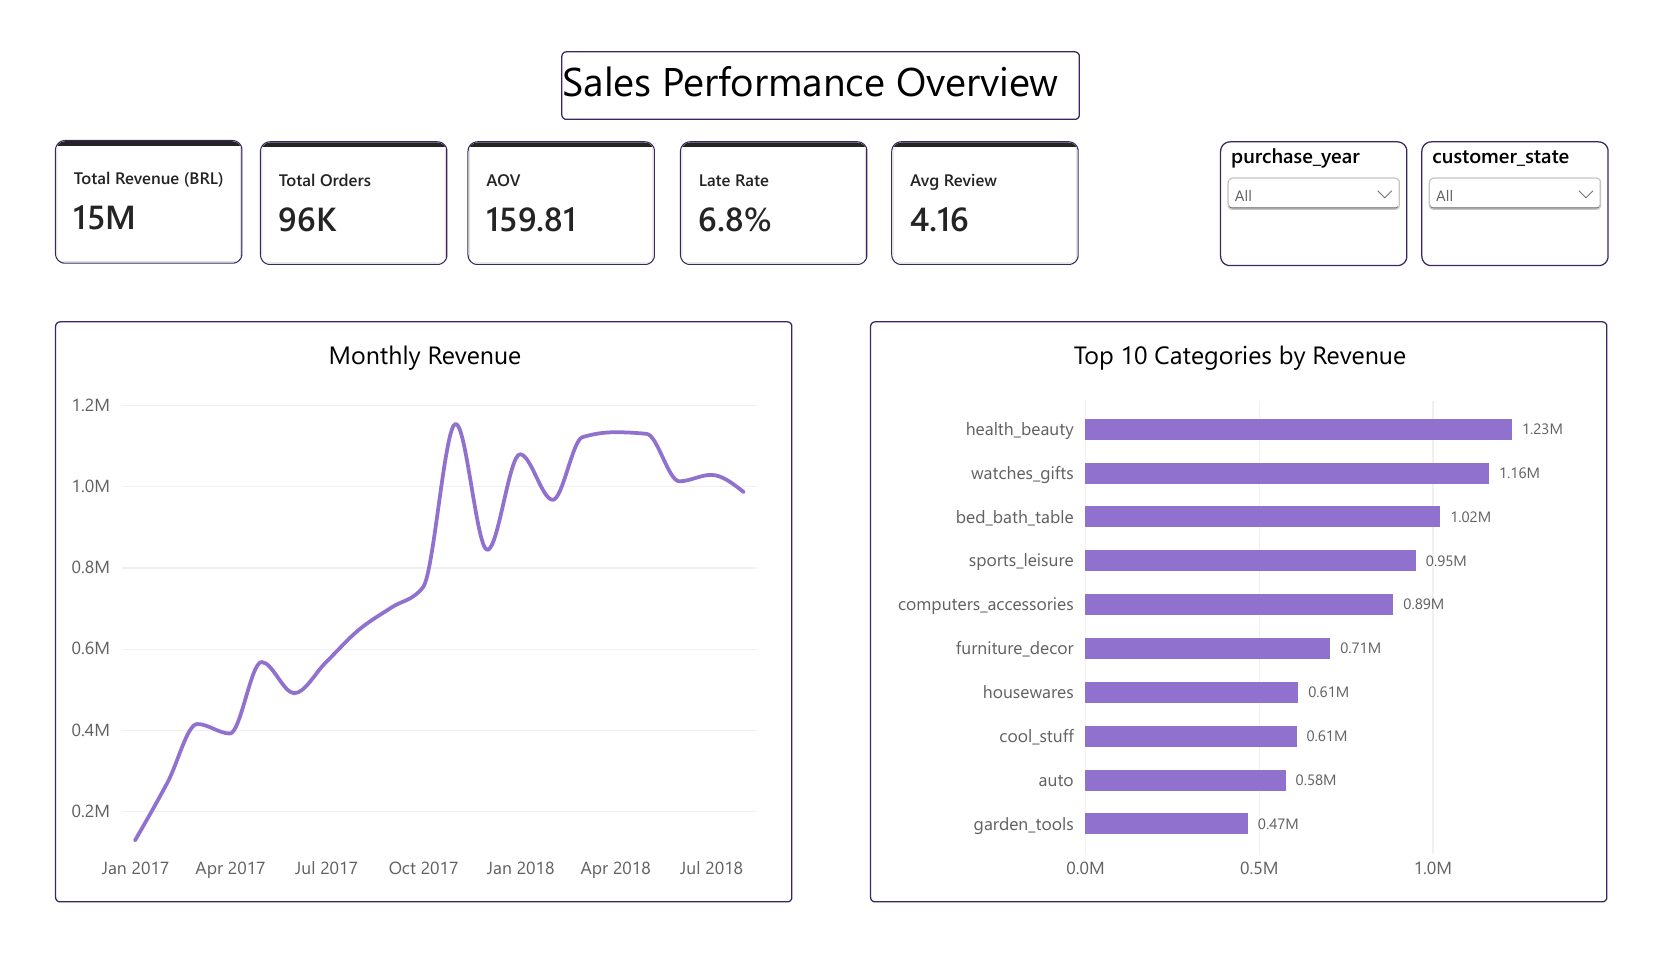
Preview of Olist sales dashboard with marketplace revenue metrics and a monthly trend chart.

01 / Interactive case study · E-commerce

What drives marketplace revenue—and where does delivery performance weaken the customer experience?

I analyzed roughly 96,000 delivered orders from the Brazilian Olist marketplace — about R$15M in revenue — and built an interactive view of revenue, order volume, category demand, late delivery, and review scores. Late-delivery hotspots by state are traced through to their effect on customer review scores.

Read case study

Also built

Other analysis work.

  • 02 / Dashboard · Climate

    Power BI · Excel

    Weather data analysis dashboard

    An interactive Power BI dashboard analyzing climate trends across Canadian cities, with KPI metrics, trend visualizations, and filters. Raw datasets were cleaned in Excel and Power BI before modeling.

    Report artifact not yet published · Related visual study: A climate record drawn as a spiral

  • 03 / Reporting practice · Industry

    Power BI · SQL · Excel

    Operational and environmental reporting

    Across roles at CogniParse and IRALCO I have built recurring Power BI reporting on accuracy and model performance, and analyzed environmental and operational plant data for management decisions. This work is not publishable, so it is described rather than shown.

    Client and employer work · See the full experience

Only work with a public artifact appears as a full case study. Everything else is described plainly, without screenshots I cannot share.

Get in touch

Open to data analyst roles in Vancouver and remote.

If you are hiring for reporting, analysis, or data quality work, I would be glad to talk through what I have built and how I approach it.