Total revenue
R$ 15.4mBRL, payment valueOlist / E-commerce analytics / Case study 01
Sales performance, made legible.
An explorable view of marketplace revenue, order volume, delivery performance, and category demand across Brazil.
The question
What drives marketplace revenue - and where does delivery performance weaken the customer experience?
I analyzed delivered orders to make sales patterns, category demand, delivery timeliness, and review scores easier to inspect together.
The web version is a coded reconstruction. The PDF is the original Power BI report and remains available as the source artifact.
Explore the report
One case study, three report views.
Interactive web versionOpen original Power BI report (PDF)
Interactive controlsFull reported scope
Interactive web version / 01
The sales signal, at a glance.
Delivered orders only. Revenue uses recorded payment value; category ranking uses item price.
Total orders
96,211Delivered purchasesAverage order value
R$ 160Revenue per orderLate delivery rate
8.1%Positive delay_daysAverage review
4.16Out of 5.0Scope note. The coded extract has 96,211 delivered orders and uses positive delay_days as late (7,822 orders; 8.1%). The original PDF reports 95,879 orders and 6.8% from an earlier prepared-model snapshot. These values are intentionally shown as separate source definitions.
01Revenue over time
Monthly payment value
Revenue rises from R$ 120k in January 2017 to roughly R$ 1.0m in August 2018, with its highest monthly value in late 2017.
02Category rank
Top categories by item price
Health and beauty leads the available full-scope item-price ranking.
| Revenue definition | Recorded payment value for delivered orders |
|---|---|
| Category definition | Item price, not payment value |
| Date range | Purchase dates from January 2017 through August 2018 |
Interactive web version / 02
Delivery performance by customer state.
Compare lateness, delivery time, customer satisfaction, and revenue without treating correlation as causation.
01State comparison
Highest late-delivery rates
The table below gives the full state-level detail for the selected filters.
02Experience signal
Delivery speed and review score
Each point represents a customer state; point size reflects delivered-order count.
03Review distribution
Customer satisfaction distribution
Review-score counts use records with a reported review.
| State | Delivered orders | Late rate | Average delivery days | Average review | Revenue |
|---|---|---|---|---|---|
| Loading interactive table… | The static PDF remains available while data loads. | ||||
Interactive web version / 03
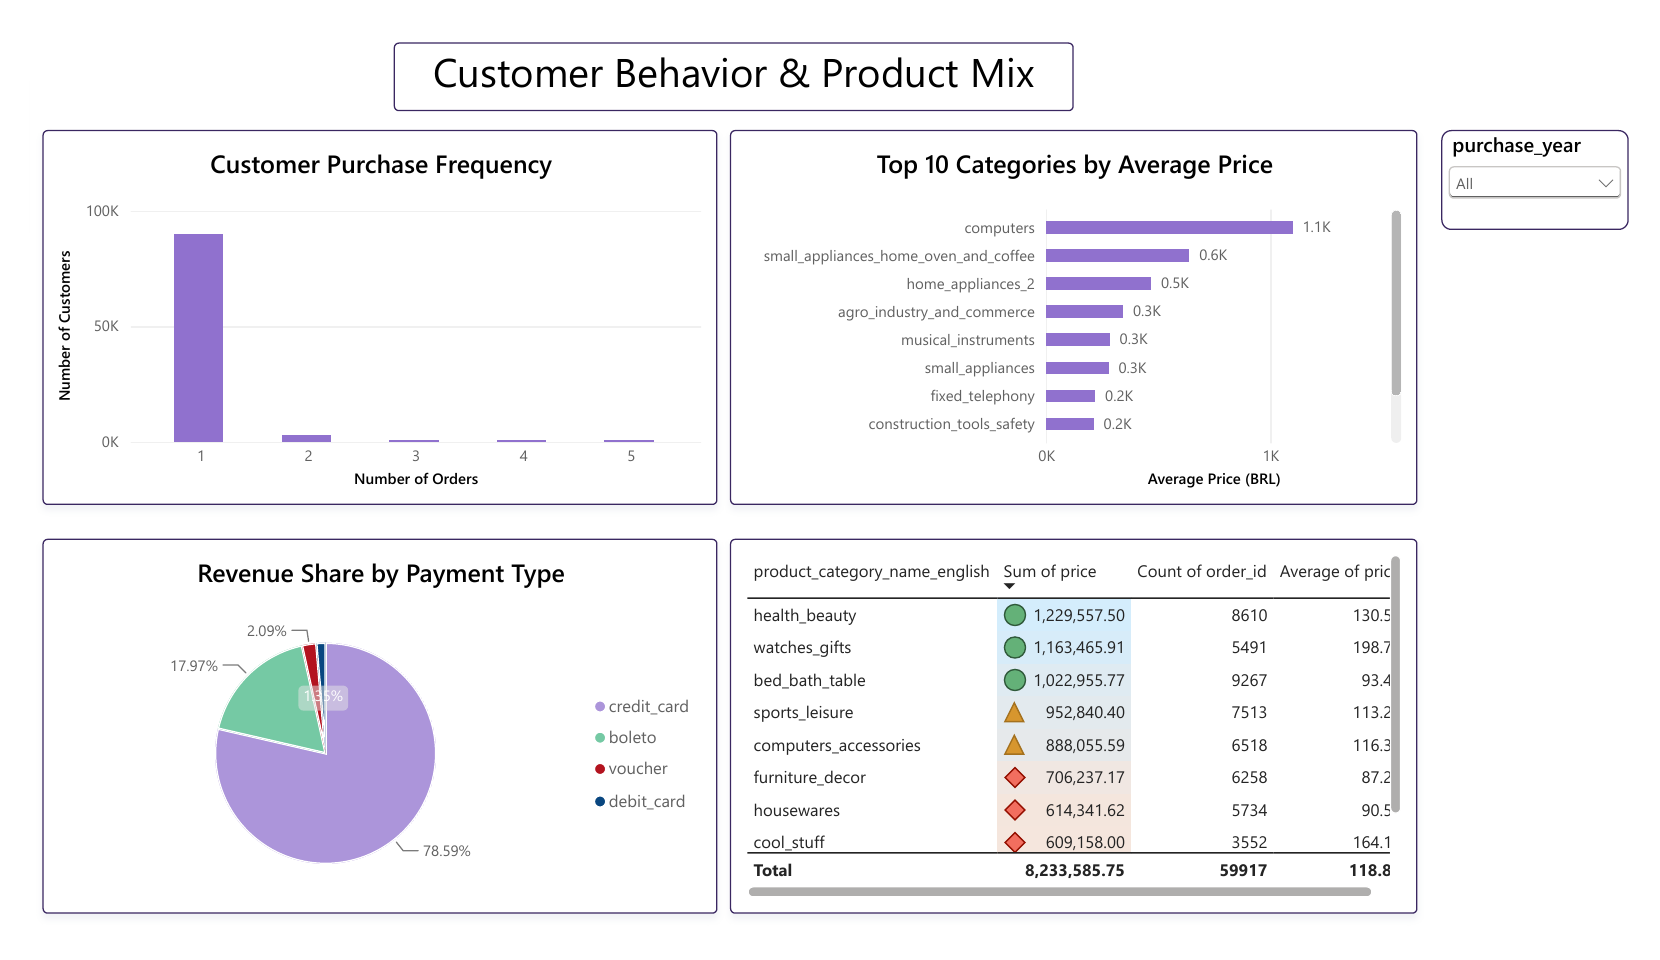
Customer behavior & product mix.
Who comes back, what the expensive categories are, and how customers choose to pay for an order.
01Repeat purchase
Customer purchase frequency
Across the full reported scope about 90,315 customers placed exactly one delivered order and only 19 placed five or more. The customer axis is log-scaled so the repeat-buyer columns stay visible next to it.
02Price rank
Top 10 categories by average price
Computers leads the full-scope average item price at roughly R$ 1,100, well ahead of the appliance categories behind it.
03Payment behavior / substitute measure
Revenue share by installment plan
Payment value is split across installment bands; the tooltip gives each band's share of the selected revenue.
Substitute measure, not a reproduction. The original page charted Revenue Share by Payment Type — credit card, boleto, voucher and debit card. The supplied extracts record max_installments and n_payments but no payment-method column, so that split cannot be rebuilt from this data. Installment plan is the closest payment-behaviour measure the extract supports, and it is what the chart above shows.
| Category | Revenue | Orders | Items | Average price |
|---|---|---|---|---|
| Loading interactive table… | The static PDF remains available while data loads. | |||
Interactive filters and charts load from the supplied Olist extracts. The visible metric and table summaries remain available without JavaScript.
What I found
A report is useful when it makes the next question clearer.
Finding 01
Revenue accelerated through late 2017.
Monthly payment value rises from early-2017 levels to more than R$ 1m in several late-2017 and 2018 months.Finding 02
Delivery experience varied by state.
State-level views reveal different late-rate, delivery-duration, and review patterns that warrant investigation rather than causal claims.Finding 03
Category revenue and category price answer different questions.
The sales view ranks total item-price contribution; the product-mix view separates average item price, which reorders the table entirely — health beauty leads on revenue, computers on price.Method and limits
Definitions stay close to the evidence.
The coded views use the supplied fact_orders.csv and fact_items.csv extracts. Delivered orders with purchase years 2017 and 2018 are included. Revenue is recorded payment value, while category ranking uses item price.
The Power BI PDF and the coded extract do not have the same prepared-model scope. The PDF is preserved as the original artifact; its 95,879-order / 6.8% values are not used to overwrite the coded extract's 96,211-order / 8.1% values.
All three report views are now interactive reconstructions. The one visual I could not rebuild is the original payment-type revenue share: these extracts record max_installments and n_payments but no payment method, so installment plan stands in for it. Next, I would validate the source model's earlier exclusion rules and source the payment-method field.