Canadian weather trends, 2021–2025

A Power BI report that compares rainfall, snowfall and temperature extremes across four Canadian cities, with year and city filters on every page.

Role
Data cleaning, modeling, dashboard design
Data
Airport weather stations in Vancouver, Calgary, Toronto and Montreal, 2021–2025
Tools
Power BI, Excel, Power Query
Deliverable
3-page interactive Power BI report

Problem

How do rain, snow and temperature extremes differ between Canada's largest cities, and how does that change from one year to the next?
Approach

  • Cleaned the raw station datasets in Excel and Power Query, then loaded them into a single Power BI model.
  • Added year and city slicers to every page, so each view can be narrowed to one year or a subset of cities.
  • Designed each page around one question: how much precipitation falls and when, how extreme the temperatures get, and where the snow is.

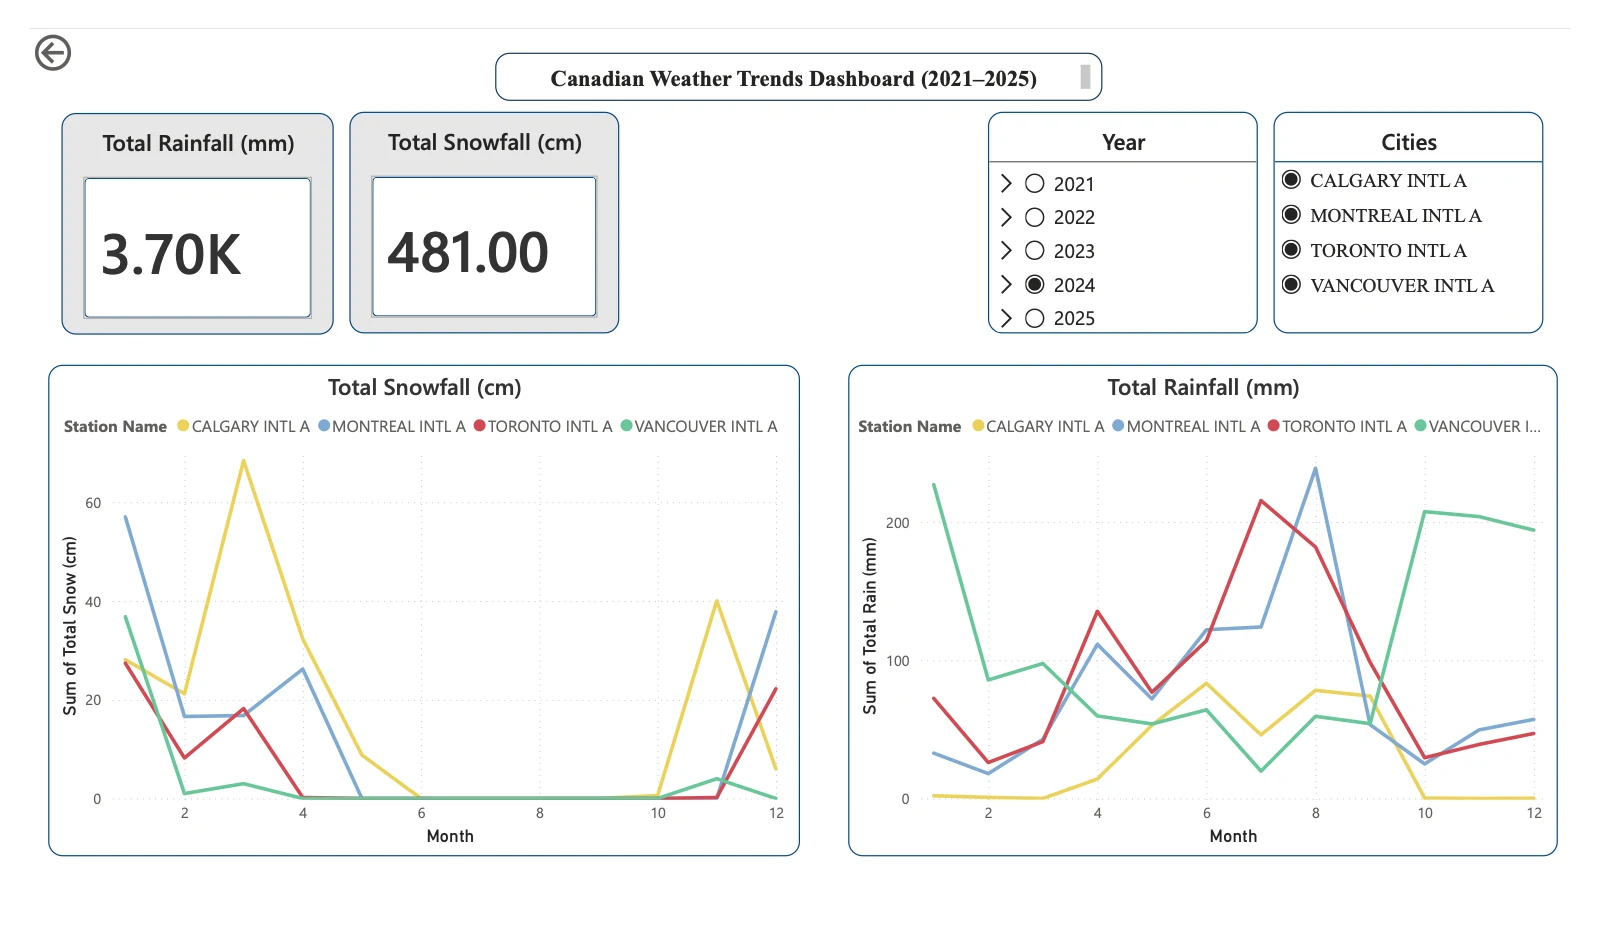
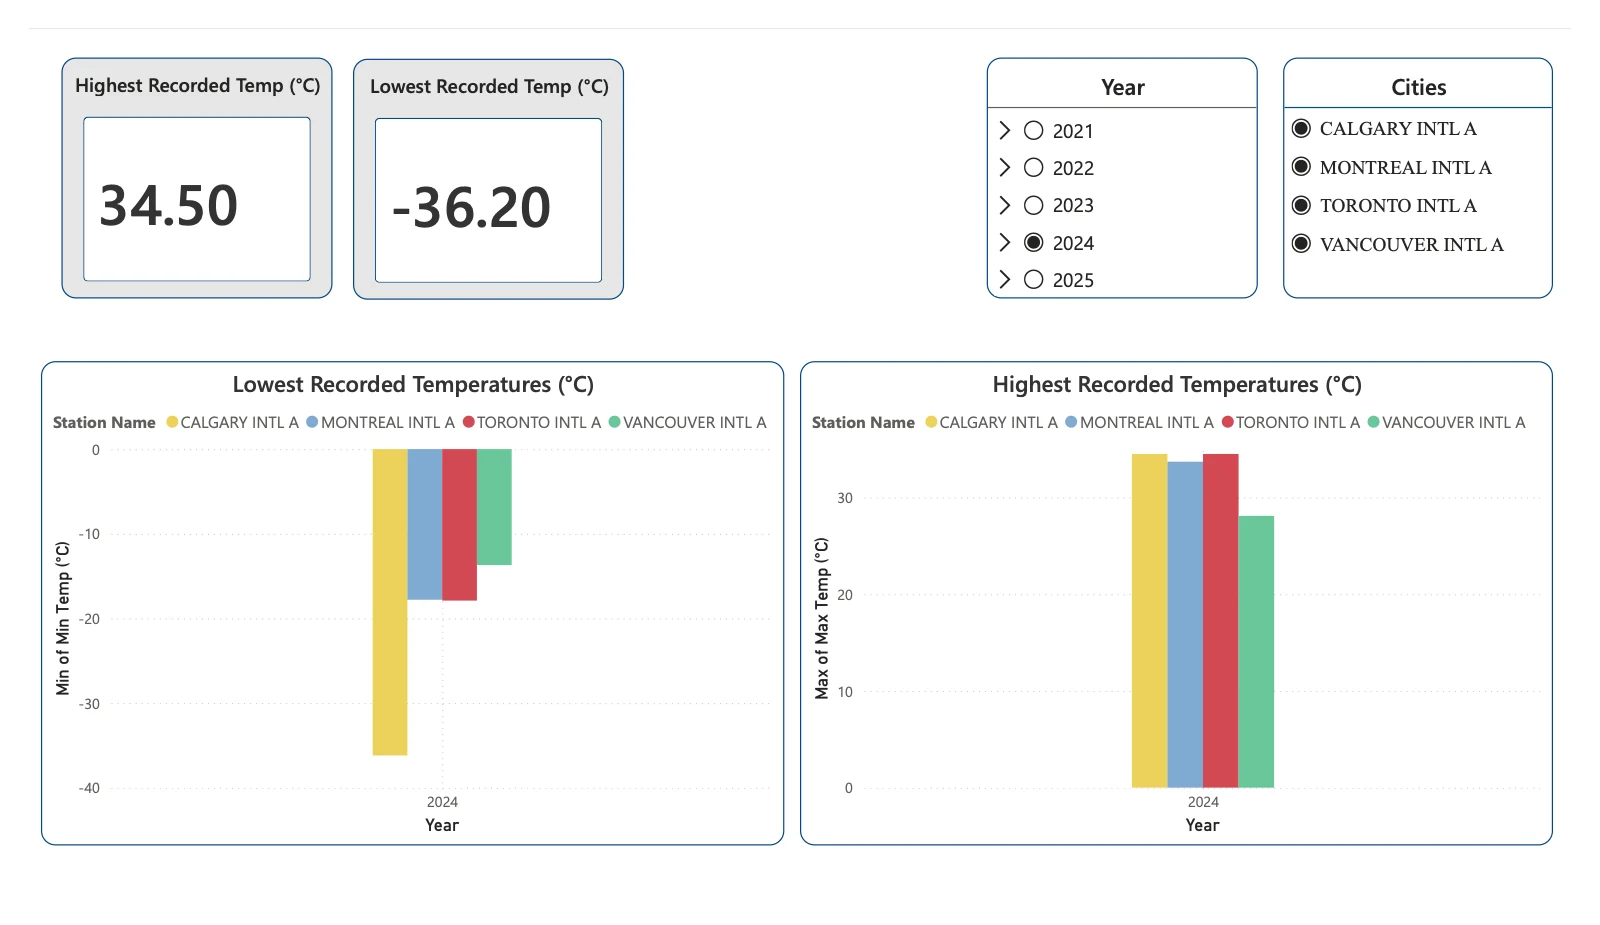
Shown with 2024 selected and all four cities included.

Power BI page with total rainfall of 3.70K mm and total snowfall of 481 cm, and two line charts of monthly snowfall and rainfall for the four stations.
Precipitation. Monthly rainfall and snowfall by station, with yearly totals.
Power BI page showing a highest recorded temperature of 34.5°C and a lowest of −36.2°C, with bar charts of each station's extremes.
Temperature extremes. Highest and lowest readings for each station.
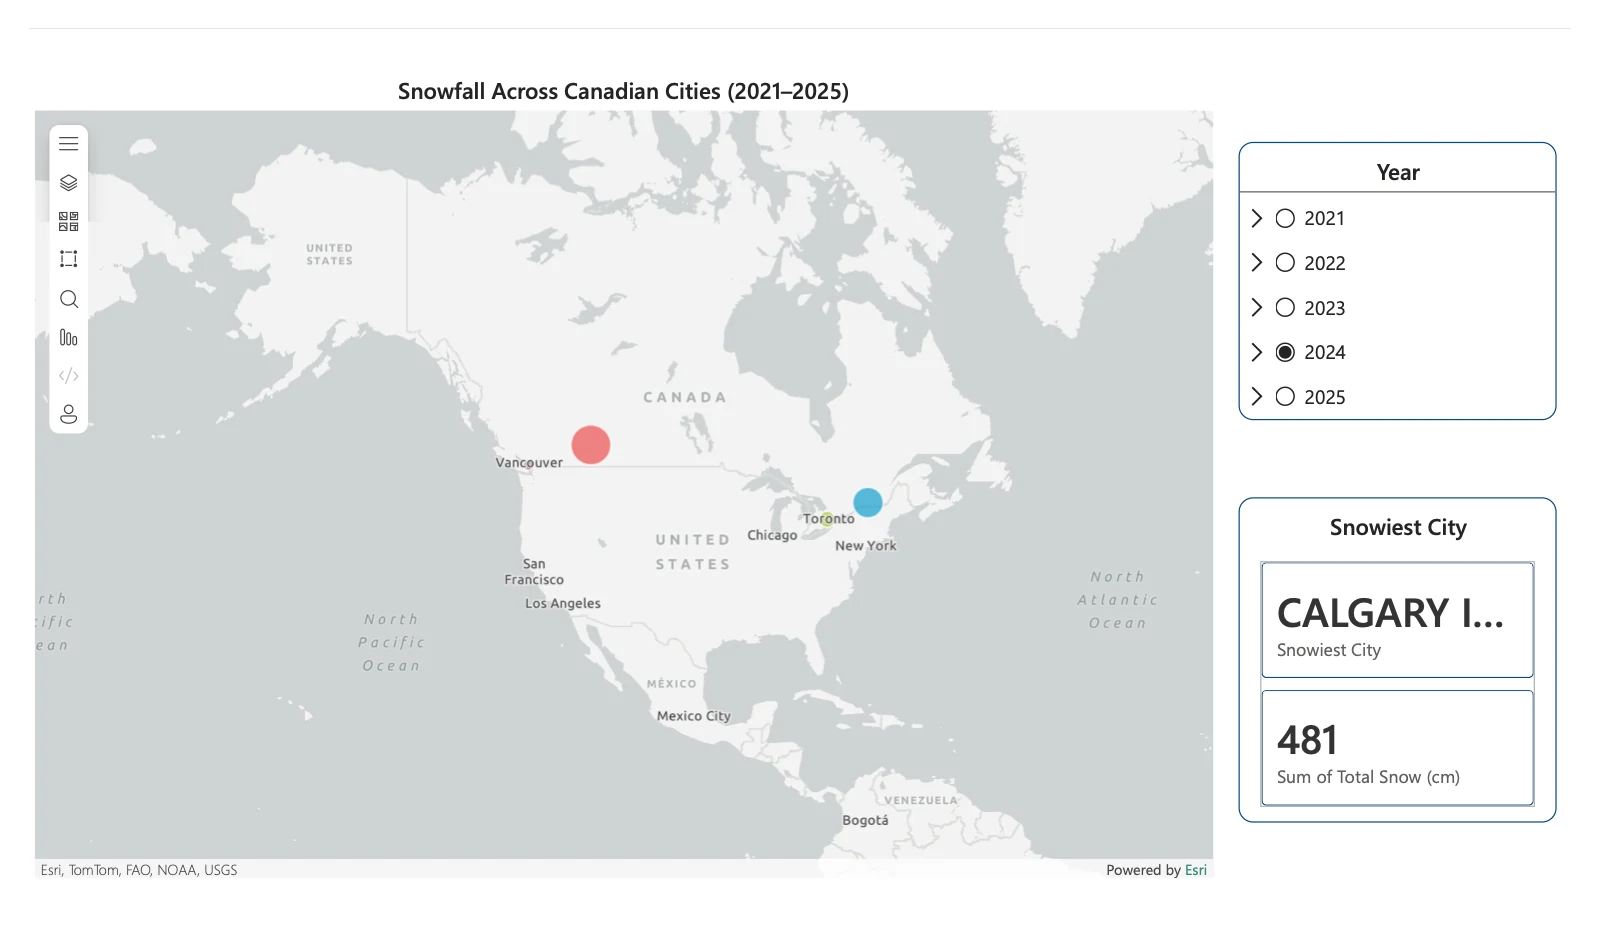
Map of North America with bubbles sized by snowfall at each city, and a card naming Calgary as the snowiest city.
Snowfall map. Bubble size shows each city's snowfall; a card names the snowiest city for the selected year.

Key findings for 2024

Vancouver's rain comes in winter

Vancouver had over 200 mm of rain in January and again in each month from October to December, far more than any other city in those months.

Toronto and Montreal peak in summer

Rainfall in the two eastern cities rose through the summer, reaching about 215 mm in Toronto in July and about 240 mm in Montreal in August.

Calgary is the snowiest and coldest

Calgary had the most snow, peaking near 70 cm in March, and the lowest reading of the year at −36.2 °C.

Vancouver has the mildest range

The year's high across all four cities was 34.5 °C. Vancouver's high stayed below 30 °C and its low was about −14 °C.

Limitations

Each city is represented by one airport weather station, which can differ from conditions elsewhere in the metro area. Totals on the precipitation page add all selected stations together, so they're for comparing selections rather than describing any one city.

Five years is too short to call anything a climate trend. The report is best used to compare cities and years, not to project forward.

Back to projects

Contact

I'm looking for data analyst roles in Vancouver or remote. Send me an email or a message on LinkedIn.

LinkedIn GitHub